
-
Wind power
Extracting power from wind
The document put in link below gives a detailed description of the different types of wind turbines and explicit Betz' formula giving the maximum power available on the shaft as a function of wind speed.
Open the document (French language)
Betz theorem - limit of the power extracted from the wind
The following demonstration allows understand the reasoning behind used by Albert Betz himself to explain his theorem and the limit of the power extracted from the wind in his book Wind-Energy published in 1926.
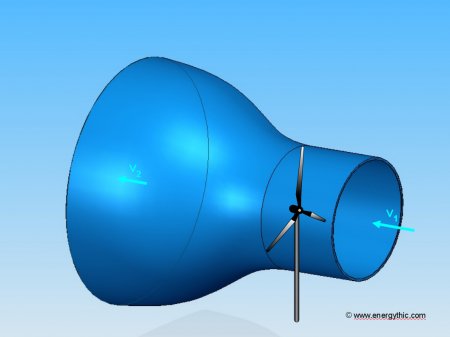
Let's assume that the average wind speed through the area swept by the rotor is equal to the average of the undisturbed speed V1 to the front of the wind turbine, and the speed V2 of the surface after passage through the rotor plane, or (V1 + V2) / 2 (Betz explains the basis for this hypothesis in his book).
The mass of the air passing through the area swept by the rotor in a second surface is then equal to:
m = ρ S ( V1 + V2 ) / 2
where m is the mass per second, ρ the air density, S the area swept by the rotor, and (V1 + V2) / 2 the average wind speed through the rotor.
The power extracted from the wind by the rotor is equal to the mass times the square of the decrease of the wind speed (according to Newton's second law) :
P = 1/2 m (V12- V22)
Substituting m (from the first equation) in this expression, we get the following formula for power extracted from the wind :
P = ρ S (V12- V22) (V1 + V2) /4
Let us now compare our results with the total power of an undisturbed air flow through a similar surface S without the presence of a rotor which slows down the wind. We call this power P0 :
P0 = ρ V13 S /2
The ratio between the power extracted from the wind and that of the undisturbed wind will then be :
(P / P0) = 1/2 [ 1 - (V2 / V1)2 ] [ 1 + (V2 / V1) ]
We can trace P / P0 depending on V2 / V1 :
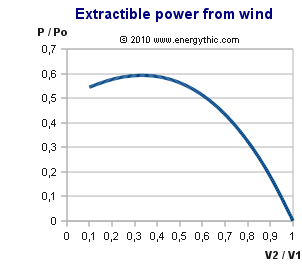
The function represented in the chart above peaked for V2 / V1 = 1/3, and the maximum value for the power extracted from the wind is equal to 0.59 or 16/27 of the total power contained in the wind.
Le facteur de capacité
Le facteur de capacité d'une éolienne sur un site correspond à sa production annuelle divisée par la production théorique maximale de cette éolienne si elle fonctionnait à sa puissance nominale (maximale) pendant l'ensemble des 8 766 heures (365,25 x 24) que compte une année. Le facteur de capacité correspond au ratio entre la quantité réelle d'énergie produite sur une année et la production théorique maximale d'une éolienne fonctionnant à pleine puissance à plein temps. Par exemple, pour une éolienne de 500 kW produisant 1,2 millions de kWh en un an on aura un facteur de capacité égal à 1 200 000/(8 766 x 500) = 0,274 soit 27,4%. En théorie, un facteur de capacité est compris entre 0% et 100%, dans la pratique il se trouvera plutôt compris entre 25% et 30%. Bien qu'un facteur de capacité élevé soit en général à préférer, ce n'est pas obligatoirement un avantage d'un point de vue économique. Sur un site très venté il sera peut être plus judicieux économiquement d'utiliser une éolienne avec un plus petit Rotor (donc un facteur de capacité plus faible qu'avec un rotor plus grand) mais qui sera moins chère.
On peut tabler sur le nombre d'heures productives annuelles suivantes selon la localisation d'installation de l'éolienne:
- éolienne offshore bien ventée: 3500 heures
- éolienne onshore: 2200 heures
Classification of various wind turbines
There are mainly two types of static wind turbines : those with vertical rotation axis and those with horizontal rotation axis. From more complex technologic design, horizontal axis wind turbines are those that get the most power from wind. Another technology, dynamic wind turbines, combines the effect of wind speed and of mobile speed powered by the wind.
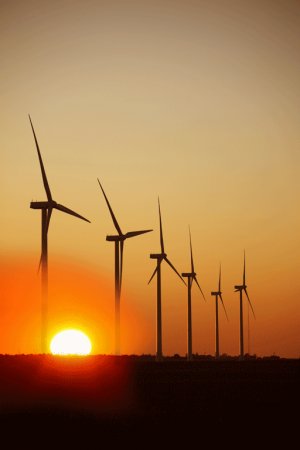
Farm of wind turbines ECO 100 in Spain
Photographie publiée sur notre site avec l’aimable autorisation d’Alstom, reproduction interdite.
Photograph published on our site with courtesy of Alstom, reproduction prohibited.Description of various types
Growth forecast
The International Energy Agency (I.E.A) expects a 5-fold increase of the global wind power that will exceed 660 TWh in 2015. The table below shows the global evolution of the electric power supplied by onshore and offshore wind turbines.
Year Worldwide
capacity
(MW)Growth
(MW)Growth
(%)European
capacity
(MW)Actual generation [TWh]
1995 4 800 - - 1996 6 100 1 300 27.1 1997 7 480 1 380 22.7 1998 9 667 2 187 29.3 1999 13 701 4 034 64.4 2000 18 040 4 339 31.7 2001 24 319 6 279 34.9 2002 31 181 6 862 28.3 2003 41 343 10 162 32.6 2004 49 463 8 121 19.7 2005 59 137 9 674 19.6 2006 74 178 15 041 25.5 40 000 2007 93 952 19 775 26.7 2008 121 328 27 376 29.2 2009 157 912 36 584 30.2 2010 194 560 36 548 23.2 2011 237 024 42 464 21.8 94 073 2012 282 684 45 660 19.3 106 838 2013 318 513 35 829 12,7 118 430 Objectif bleu 2020 575 000 296 France has focused on wind energy goals set during Grenelle Environment Forum, with the installation in 2020 of 19 GW onshore wind capacity and of 6 GW offshore wind capacity.
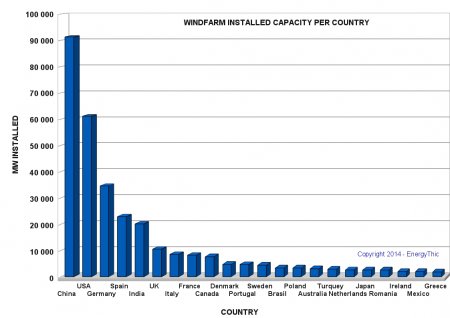
Worldwide installed capacity

Puissance installée en France
Puissance totale installée en service au 17 juillet 2012 : 6 869 MW (8 254 MW au 31/12/2013)
Energie produite estimée pour l'année 2012 : 15,9 TWh
Cette capacité correspond à environ 2.2% du parc mondial. Source: suivi-eolien.com. L'objectif est d'atteindre 20% de la puissance électrique installée en 2018, soit environ 15 000 MW (12000 MW au 31/12/2016).
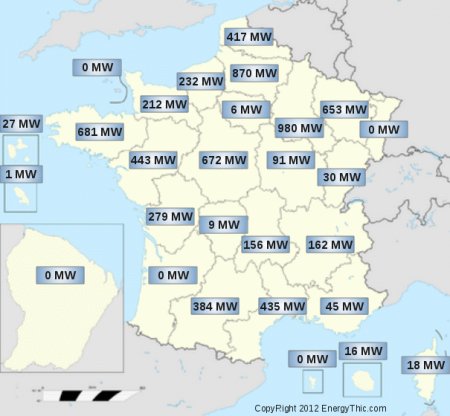
Puissances par région Région Alsace 0 MW Région Aquitaine 0 MW Région Auvergne 156 MW Région Basse-Normandie 212 MW Région Bourgogne 91 MW Région Bretagne 681 MW Région Centre 672 MW Région Champagne-Ardenne 980 MW Région Corse 18 MW Région Franche-Comté 30 MW Région Guadeloupe 27 MW Région Guyane 0 MW Région Haute-Normandie 232 MW Région Ile-de-France 6 MW Région Languedoc-Roussillon 435 MW Région Limousin 9 MW Région Lorraine 653 MW Région Martinique 1 MW Région Mayotte 0 MW Région Midi-Pyrénées 384 MW Région Nord-Pas-de-Calais 417 MW Région Nouvelle-Calédonie 38 MW Région PACA 45 MW Région Pays de la Loire 443 MW Région Picardie 870 MW Région Poitou-Charentes 279 MW Région Polynésie française 0.08 MW Région Réunion 16 MW Région Rhône-Alpes 162 MW Région Saint-Barthélemy 0 MW Région Saint-Martin 0 MW Région Saint-Pierre-et-Miquelon 0.6 MW Région Terres australes et antarctiques 0 MW Région Wallis-et-Futuna 0 MW Dangers des éoliennes pour la santé
Avec la multiplication récente du nombre d'éoliennes en France et dans tous les pays soucieux de diminuer l'impact de l'effet de serre, de nombreux griefs sont avancés par les anti-éoliens à l'encontre de cette technologie: dangerosité des infra-sons pour la santé, dangerosité des pales pour les oiseaux migrateurs. Le rapport suivant publié par l'Académie Nationale de Médecine, en date du 14 mars 2006, détruit certaines croyances et phantasmes relatifs aux infra-sons. Selon ce rapport, il n'existe pas de dangers avérés liés à la production d'infrasons par les éoliennes.
Lire le rapport publié par l'Académie de Médecine le 15 mars 2006: Le retentissement du fonctionnement des éoliennes sur la santé de l'homme
